Analytics Dashboard
Enhance team management by effortlessly monitoring task progress and blockers
Services
Sector
Overview
This dashboard provides a comprehensive view of team performance across multiple projects within a workspace. It enables users to track task status and monitor task activities in real time.
With intuitive data visualizations, team leaders can quickly identify progress, areas that need attention, and any potential blockers that could impede project timelines.
The dashboard fosters efficiency by offering insights into task distribution and completion trends, helping teams stay aligned and focused on their goals.
Objective
Enhance the reporting and analytics features within the workspace, making it easier for managers to monitor their team's task progress and prevent blockers in advance.
Problems
1. Manual Reporting : The previous dashboard did not meet customer data needs. Customers struggled to generate reports due to the missing data, which caused manual calculation.
2. Irrelevant Data : Managers faced difficulties in evaluation team performance, as the previous dashboard lacked sufficient insights for performance assessment.
3. Maintenance issue : The previous dashboard, developed by a third party, and was challenging to maintain.
Solutions
1. Enhanced generating report : new dashboard was including diverse filtering options and the ability to export data to excel for easy report generation. Customers can easily transform the data as they want to see and also download data to create their own report.
2. Displayed the key data customers requested : The new dashboard includes preset chart that reflect the key data customers requested during interviews, enabling them to effectively manage bottlenecks and monitor team performance.
Challenges
1.Select data customers wish to view on dashboard :
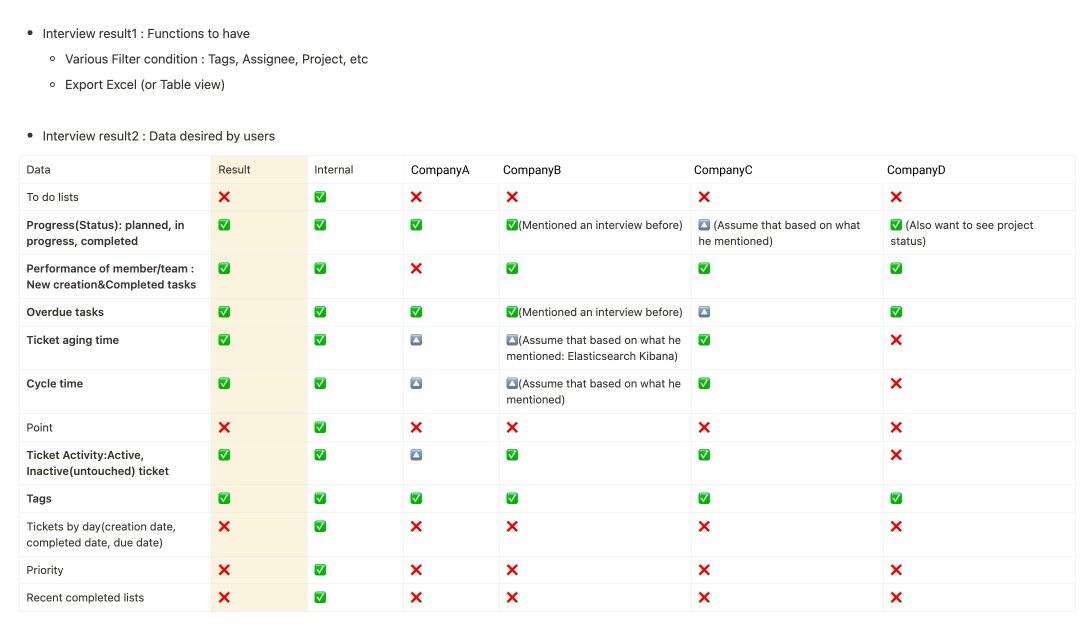
To determine the data customers wanted on the dashboard, I interviewed them to gain insights into the key metrics they manage for team and task performance, their dashboard experiences, current reporting processes, pain points, and areas for improvement.
They highlighted the importance of tracking task cycle time, exporting Excel files, monitoring assignee performance, and tracking ticket activity to effectively monitor team performance and address bottlenecks swiftly.
2. How to efficiently present the data :
I collaborated with the developers and data team to decide on the graph style and top filters.
In this phase:
- Finalized top filters: Date, Project, Assignee, Tag, and Aggregation.
- Decided on chart details: style, X and Y axis data, and colors.
- Assessed how top filters impact each graph on the dashboard.
Some graphs, like cycle time, were deferred to the next phase and replaced with lead time for the MVP due to limitations in filtering specific tasks and columns in the preset dashboard.
F
Interview summary
Brainstorming session
Project Highlight
Enhance the functionalities for reporting
New dashboard introduces essential filtering options, delivering diverse data insights tailored to user preferences and the ability to export data to excel for customized report creation, based on customer feedback from interviews.
MVP dashboard features a preset style dashboard, and it was crucial to examine the impact of the top filters on each graph and ensure their compatibility and coherence across the entire dashboard.
Key data customer requested
01. Lead time for Created & Completed tasks
Users can view the average duration from task creation to completion. This information provides users with an understanding of the typical time it takes to complete tasks, so they can manage manpower and time efficiently for a project.
02. Task activities
This chart shows the trend of task activities, highlighting comment frequency over time. Previously, users manually checked tasks for comments, which could cause delays. Now, users can quickly evaluate activity trends for specific projects or individuals, making it easier to spot and address declines in activity. In the MVP, the chart displays only task comments, but in the second phase, it will also include a trend line for task updates.


